After the 2020 election, IFS published an article arguing that there was a “conservative fertility advantage”—basically, that conservatives have more babies than liberals. That fact appears to have become even more true in 2024.
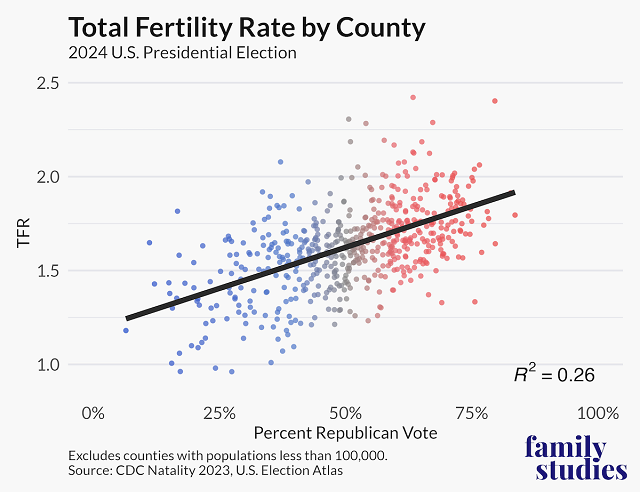
As the figure below shows, there is a clear relationship between the share of people in a county who voted for President Trump in 2024, and county-level total fertility rates estimated by the CDC.

Those counties that voted for Trump tended to have much higher fertility rates than those that did not. This relationship is quite strong. For every 10% increase in votes for Trump in 2024, there is an expected increase of 0.09 babies in a woman’s lifetime. While 0.09 babies does not sound like much, the effect of this Republican advantage shows most prominently at the tail ends of county votes. Counties that had less than 25% of their vote share for Trump, such as D.C., had a median total fertility rate of 1.31. In contrast, counties that had more than 75% of their vote share for Trump had a median total fertility rate of 1.84.
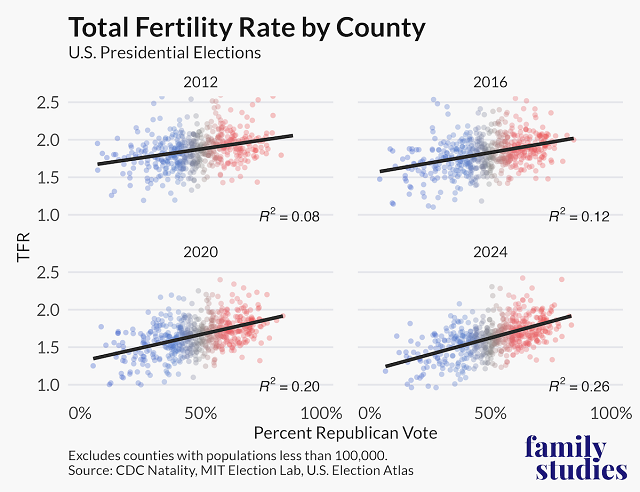
This relationship between voting Republican and having more babies is growing stronger over time. In 2012, a 10% increase in votes for Romney within a county saw an expected increase of 0.05 in the total fertility rate, compared to 0.09 in 2024. In the past 12 years, the geographic relationship between voting Republican and having more babies has grown by 85 percent.

Not only is the fertility gap between very-Republican and very-Democratic places widening, but it seems like fertility behavior is increasingly well-predicted by partisanship. Whereas in 2012 just 8% of the variance in fertility between counties was accounted for by vote share, that number has grown to 26% by 2024. Over a quarter of the variance in county fertility rates can be accounted for by political partisanship. Essentially, the parties are divided by family.
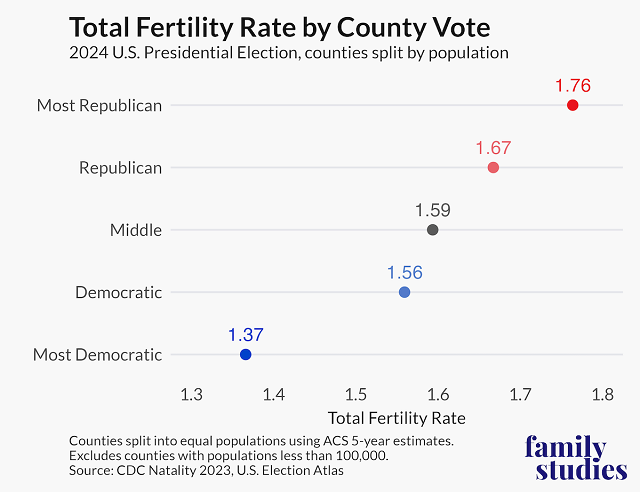
We get a clear picture of the fertility gap when we divide counties into five groups with equal population along partisan lines. The 20% most Republican counties have an aggregate total fertility rate of 1.76. The 20% most Democratic counties have an aggregate total fertility rate of 1.37, less than the EU.

We should note that this dataset only accounts for counties with populations over 100,000 due to the CDC’s privacy protection policy, which excludes smaller, more rural counties who predominately voted for Trump. But using the Census’ American Community Survey, which accounts for all counties (though with less reliability), we did not find a substantial impact when smaller county survey data was included.
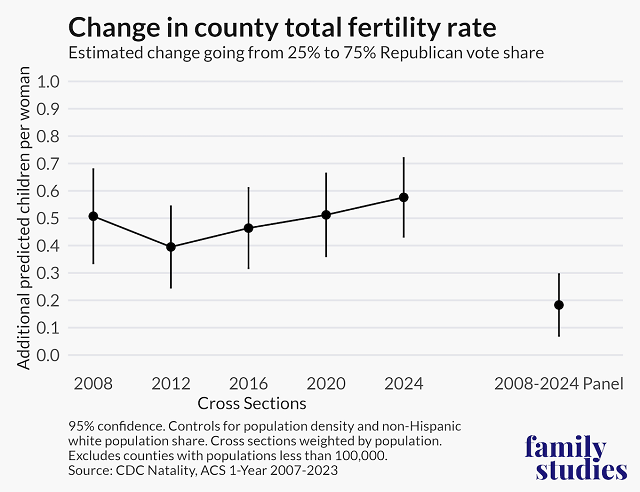
Finally, as in our 2020 post, we wanted to analyze this data just a bit more robustly. To do so, we used a fixed effects model, which allows us to assess not just the correlation between partisanship and fertility in a given year, but the link between partisanship and fertility over time within counties. In essence, the results from this panel model can answer questions like, “When a given county swings more to the right than the nation as a whole, does its fertility increase relative to other counties?”

After controlling for population density and the proportion of population that is white, a 50% difference in the GOP vote share within a given year was associated with about 0.5 more children born per woman across the five election cross-sectional data cuts. But is it the case that when a county moved to the right, its fertility had a more positive trend? The answer is yes: the panel results show that a 50% swing in a Republican vote share is followed by an expected additional 0.2 children per woman versus other counties. No counties actually shifted by 50%, but the key point is that across counties in a given time, as well as within counties over time, Republican vote share has the same, broadly positive relationship with fertility.
A few notes of caution. The data here does not establish a causal direction: whether becoming conservative causes higher fertility rates, or having babies makes people more conservative. The evidence suggests causality flows in both directions, as we noted in 2020. Additionally, there are further structural variables to consider. Differences in education levels, for instance, explain much of the variance in birth rates between Republican and Democratic counties.
Moreover, the Republican fertility advantage does not mean that conservatism has an inevitable, long-term “demographic destiny.” When children grow up, their political beliefs are only moderately correlated with their parents’ political beliefs.
Finally, Patrick T. Brown noted in an earlier IFS blog post that Republican counties do not significantly differ from Democratic counties in the proportion of babies born to married parents, contrary to years past. So, while Republican counties have higher fertility rates, these babies are not necessarily being born into more stable families.
Nonetheless, the growing fertility divide has important political implications. Republicans live in areas where families are larger, and where more voters would directly benefit from policies like the Child Tax Credit. Democrats, on the other hand, live in areas where families are smaller and rarer. How this increasing polarization in family size might influence politics over the next election cycle remains to be seen.
Grant Bailey is a Research Associate of the Institute for Family Studies. Lyman Stone is Senior Fellow and Director of the Pronatalism Initiative at the Institute for Family Studies.
